390 lines
10 KiB
Markdown
390 lines
10 KiB
Markdown
# 终端图表命令行工具
|
||
|
||
`CLI` `图表` `终端` `Node.js` `数据可视化`
|
||
|
||
|
||
|
||
# chartli
|
||
|
||
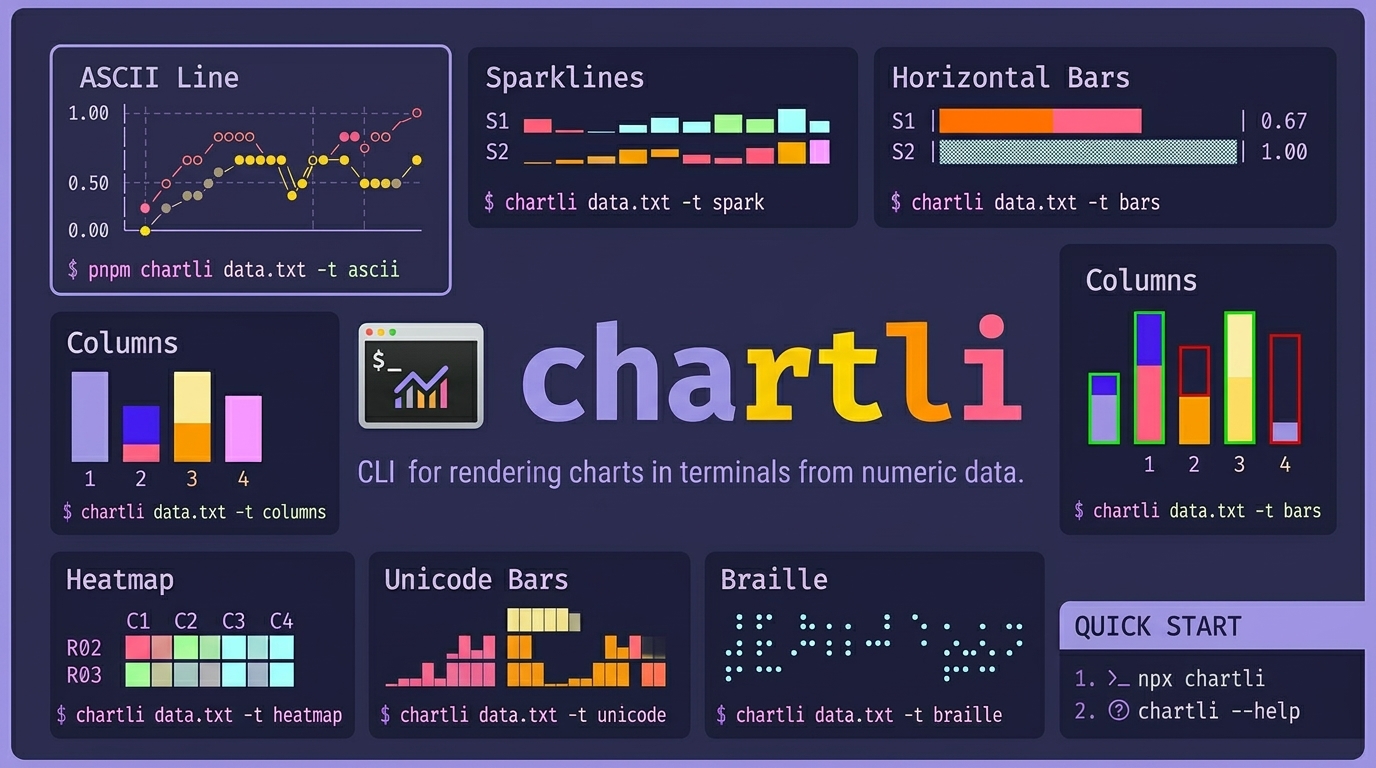
用于在终端中从数字文本数据渲染图表的命令行工具。`chartli` 将纯数字转换为终端图表,支持 ascii、spark、bars、columns、heatmap、unicode、braille、svg 等多种类型。
|
||
|
||
## 安装
|
||
|
||
即时运行:
|
||
|
||
```sh
|
||
npx chartli --help
|
||
```
|
||
|
||
或全局安装:
|
||
|
||
```sh
|
||
npm i -g chartli
|
||
```
|
||
|
||
## Agent 技能安装
|
||
|
||
为 agent 安装仓库技能:
|
||
|
||
```sh
|
||
npx skills add ahmadawais/chartli
|
||
```
|
||
|
||
快速开始:
|
||
|
||
```sh
|
||
npx chartli
|
||
npx chartli --help
|
||
```
|
||
|
||
## 用法
|
||
|
||
```sh
|
||
npx chartli [file] [options]
|
||
```
|
||
|
||
```text
|
||
用法:chartli [options] [file]
|
||
|
||
从数字数据渲染终端图表
|
||
|
||
参数:
|
||
file 输入文件(未提供时从 stdin 读取)
|
||
|
||
选项:
|
||
-v, --version 输出版本号
|
||
-t, --type <type> 图表类型:svg, ascii, unicode, braille, spark, bars,
|
||
columns, heatmap(默认:"ascii")
|
||
-w, --width <number> 图表宽度
|
||
-h, --height <number> 图表高度
|
||
-m, --mode <mode> SVG 模式:circles 或 lines(默认:"circles")
|
||
--x-axis-label <label> x 轴标题
|
||
--y-axis-label <label> y 轴标题
|
||
--x-labels <labels> x 轴刻度或行标签(逗号分隔)
|
||
--series-labels <labels>
|
||
绘制系列或类别的标签(逗号分隔)
|
||
--data-labels 在支持的情况下,在绘制数据附近显示原始值
|
||
--first-column-x 将第一个数字列视为 x 标签而非绘制系列
|
||
--help 显示命令帮助
|
||
```
|
||
|
||
## 标签与元数据
|
||
|
||
- 使用 `--x-axis-label` 和 `--y-axis-label` 添加坐标轴标题。
|
||
- 使用 `--x-labels` 指定刻度标签。
|
||
- 使用 `--series-labels` 替换 `S1`、`C1` 等通用标签。
|
||
- 使用 `--data-labels` 在渲染器支持时,在绘制数据上或附近打印原始值。
|
||
- 使用 `--first-column-x` 当第一个数字列是 `day`、`month`、`year` 等域值时。
|
||
|
||
使用 `--first-column-x` 时,chartli 将:
|
||
|
||
- 将第一个数字列用作 x 轴标签
|
||
- 存在表头行时,将第一个表头单元格用作 x 轴标题
|
||
- 将其余表头单元格用作系列标签
|
||
- 对于常见的两列数据,将第二个表头单元格用作 y 轴标题
|
||
|
||
示例:
|
||
|
||
```sh
|
||
pnpm chartli examples/assets/core-single-series.txt -t ascii -w 24 -h 8 --first-column-x --data-labels
|
||
```
|
||
|
||
```sh
|
||
pnpm chartli examples/assets/core-multi-series.txt -t columns -h 8 --first-column-x --series-labels sales,costs,profit --x-axis-label Metrics --y-axis-label Value --data-labels
|
||
```
|
||
|
||
## 带标签的图表示例
|
||
|
||
### 带推断坐标轴标签和数据标签的 ASCII 折线图
|
||
|
||
```sh
|
||
pnpm chartli examples/assets/weekly-signups.txt -t ascii -w 28 -h 8 --first-column-x --data-labels
|
||
```
|
||
|
||
```text
|
||
signups
|
||
91 │ ● 87
|
||
│ 91 ●
|
||
│ 73
|
||
│ ● 68
|
||
66.5 │ 58 ●
|
||
│ ● 49
|
||
│42 ●
|
||
42 │●
|
||
└────────────────────────────
|
||
1 2 3 4 5 6 7
|
||
day
|
||
```
|
||
|
||
### 带显式坐标轴标题和推断系列名称的柱状图
|
||
|
||
```sh
|
||
pnpm chartli examples/assets/weekly-metrics.txt -t columns -h 8 --first-column-x --x-axis-label Metrics --y-axis-label Count --data-labels
|
||
```
|
||
|
||
```text
|
||
Count
|
||
176 29 10
|
||
|
||
|
||
█
|
||
█
|
||
█
|
||
█
|
||
█ ▓ ▒
|
||
█ ▓ ▒
|
||
────────────────────
|
||
visits trials paid
|
||
Metrics
|
||
```
|
||
|
||
### 带坐标轴、x 标签和点标签的 SVG 图表
|
||
|
||
```sh
|
||
pnpm chartli examples/assets/weekly-signups.txt -t svg -m lines -w 320 -h 120 --first-column-x --data-labels | sed -n '/^<?xml/,$p' > examples/assets/output/weekly-signups-chart.svg
|
||
```
|
||
|
||
输出文件为 `examples/assets/output/weekly-signups-chart.svg`。
|
||
|
||
## 图表类型
|
||
|
||
- `ascii`
|
||
- `spark`
|
||
- `bars`
|
||
- `columns`
|
||
- `heatmap`
|
||
- `unicode`
|
||
- `braille`
|
||
- `svg`
|
||
|
||
## 示例数据文件
|
||
|
||
- `examples/assets/core-single-series.txt`
|
||
- `examples/assets/core-multi-series.txt`
|
||
- `examples/assets/image-data.txt`
|
||
- `examples/assets/image-single-series.txt`
|
||
- `examples/assets/image-columns-variant.txt`
|
||
- `examples/assets/weekly-signups.txt`
|
||
- `examples/assets/weekly-metrics.txt`
|
||
|
||
## 图像图表集(文本图示)
|
||
|
||
### ASCII 折线图
|
||
|
||
```sh
|
||
pnpm chartli examples/assets/image-data.txt -t ascii -w 24 -h 8
|
||
```
|
||
|
||
```text
|
||
day=● sales=○ costs=◆ profit=◇
|
||
1.00 │ ○
|
||
│
|
||
│ ◇ ◇
|
||
│ ◆ ●
|
||
0.50 │ ● ◆
|
||
│ ◇ ◆ ●
|
||
│ ○ ◆
|
||
0.00 │◇ ◆ ◇ ◇
|
||
└────────────────────────
|
||
```
|
||
|
||
### 火花线图
|
||
|
||
```sh
|
||
pnpm chartli examples/assets/image-data.txt -t spark
|
||
```
|
||
|
||
```text
|
||
day ▁▂▃▄▅▆
|
||
sales ▁▄▂▇▅█
|
||
costs ▁▂▄▃▆▅
|
||
profit ▁▄▂▇▂▇
|
||
```
|
||
|
||
### 水平条形图
|
||
|
||
```sh
|
||
pnpm chartli examples/assets/image-data.txt -t bars -w 28
|
||
```
|
||
|
||
```text
|
||
day |███████████████████ | 0.67
|
||
sales |▓▓▓▓▓▓▓▓▓▓▓▓▓▓▓▓▓▓▓▓▓▓▓▓▓▓▓▓| 1.00
|
||
costs |▒▒▒▒▒▒▒▒▒▒▒▒▒▒▒ | 0.53
|
||
profit |░░░░░░░░░░░░░░░░░░░░░░░ | 0.83
|
||
```
|
||
|
||
### 柱状图
|
||
|
||
```sh
|
||
pnpm chartli examples/assets/image-data.txt -t columns -h 8
|
||
```
|
||
|
||
```text
|
||
▓
|
||
▓ ░
|
||
▓ ░
|
||
█ ▓ ░
|
||
█ ▓ ▒ ░
|
||
█ ▓ ▒ ░
|
||
█ ▓ ▒ ░
|
||
█ ▓ ▒ ░
|
||
───────────────────────────
|
||
day sales costs profit
|
||
```
|
||
|
||
### 柱状图(变体)
|
||
|
||
```sh
|
||
pnpm chartli examples/assets/image-columns-variant.txt -t columns -h 8
|
||
```
|
||
|
||
```text
|
||
|
||
▓ ░
|
||
█ ▓ ░
|
||
█ ▓ ░
|
||
█ ▓ ▒ ░
|
||
█ ▓ ▒ ░
|
||
█ ▓ ▒ ░
|
||
───────────────────────────
|
||
day sales costs profit
|
||
```
|
||
|
||
### 热力图
|
||
|
||
```sh
|
||
pnpm chartli examples/assets/image-data.txt -t heatmap
|
||
```
|
||
|
||
```text
|
||
day sales costs profit
|
||
R01
|
||
R02 ░ ▒ ░ ▒
|
||
R03 ░ ░ ▒ ░
|
||
R04 ▒ ▓ ░ ▓
|
||
R05 ▒ ▒ ▓ ░
|
||
R06 ▓ █ ▒ ▓
|
||
```
|
||
|
||
### Unicode 条形图
|
||
|
||
```sh
|
||
pnpm chartli examples/assets/image-data.txt -t unicode
|
||
```
|
||
|
||
```text
|
||
day sales costs profit
|
||
█
|
||
▃ █ ▅ ▅
|
||
▃ █ █ ▃ █ █
|
||
▂█ █▆█ █▂ █ █
|
||
▂██ ▂ ███ ▂ ██ ▃ █ █
|
||
▁███ █ ███ █▁██ █ █ █
|
||
▁████ █▅███ ▁████ █▁█▁█
|
||
█████ █████ █████ █████
|
||
```
|
||
|
||
### 盲文点阵图
|
||
|
||
```sh
|
||
pnpm chartli examples/assets/image-data.txt -t braille -w 16 -h 6
|
||
```
|
||
|
||
```text
|
||
profit
|
||
|
||
⠀⠀⠀⠀⠀⠀⠀⠀⠀⠀⠀⠀⠀⠀⠀⠀
|
||
⠀⠀⠀⠀⠀⠀⠀⠀⠀⠁⠀⠀⠀⠀⠀⠈
|
||
⠀⠀⠀⠀⠀⠀⠀⠀⠀⠀⠀⠀⠀⠀⠀⠀
|
||
⠀⠀⠀⠄⠀⠀⠀⠀⠀⠀⠀⠀⠀⠀⠀⠀
|
||
⠀⠀⠀⠀⠀⠀⠀⠀⠀⠀⠀⠀⠀⠀⠀⠀
|
||
⡀⠀⠀⠀⠀⠀⠁⠀⠀⠀⠀⠀⠁⠀⠀⠀
|
||
```
|
||
|
||
### SVG 图表
|
||
|
||
```sh
|
||
pnpm chartli examples/assets/image-data.txt -t svg -m lines -w 320 -h 120 | sed -n '/^<?xml/,$p' > examples/assets/output/image-chart.svg
|
||
```
|
||
|
||
```text
|
||
<?xml version='1.0'?>
|
||
<svg xmlns='http://www.w3.org/2000/svg' width='650' height='120' version='1.1'>
|
||
<polyline ... />
|
||
<polyline ... />
|
||
<polyline ... />
|
||
<polyline ... />
|
||
</svg>
|
||
```
|
||
|
||

|
||
|
||
# 示例
|
||
|
||
所有示例均由 `examples/assets/` 目录下的数据文件驱动。
|
||
|
||
## 数据文件
|
||
|
||
- `examples/assets/core-single-series.txt`
|
||
- `examples/assets/core-multi-series.txt`
|
||
- `examples/assets/image-data.txt`
|
||
- `examples/assets/image-single-series.txt`
|
||
- `examples/assets/image-columns-variant.txt`
|
||
- `examples/assets/weekly-signups.txt`
|
||
- `examples/assets/weekly-metrics.txt`
|
||
- `examples/assets/output/`
|
||
|
||
## 核心命令
|
||
|
||
- `pnpm chartli examples/assets/core-single-series.txt -t ascii -w 24 -h 8`
|
||
- `pnpm chartli examples/assets/core-multi-series.txt -t spark`
|
||
- `pnpm chartli examples/assets/core-multi-series.txt -t bars -w 28`
|
||
- `pnpm chartli examples/assets/core-multi-series.txt -t columns -h 8`
|
||
- `pnpm chartli examples/assets/core-multi-series.txt -t heatmap`
|
||
- `pnpm chartli examples/assets/core-multi-series.txt -t unicode`
|
||
- `pnpm chartli examples/assets/core-single-series.txt -t braille -w 16 -h 6`
|
||
- `pnpm chartli examples/assets/core-multi-series.txt -t svg -m lines -w 320 -h 120 | sed -n '/^<?xml/,$p' > examples/assets/output/core-chart.svg`
|
||
|
||
## 图像命令
|
||
|
||
- `pnpm chartli examples/assets/image-data.txt -t ascii -w 24 -h 8`
|
||
- `pnpm chartli examples/assets/image-data.txt -t spark`
|
||
- `pnpm chartli examples/assets/image-data.txt -t bars -w 28`
|
||
- `pnpm chartli examples/assets/image-data.txt -t columns -h 8`
|
||
- `pnpm chartli examples/assets/image-columns-variant.txt -t columns -h 8`
|
||
- `pnpm chartli examples/assets/image-data.txt -t heatmap`
|
||
- `pnpm chartli examples/assets/image-data.txt -t unicode`
|
||
- `pnpm chartli examples/assets/image-data.txt -t braille -w 16 -h 6`
|
||
- `pnpm chartli examples/assets/image-data.txt -t svg -m lines -w 320 -h 120 | sed -n '/^<?xml/,$p' > examples/assets/output/image-chart.svg`
|
||
|
||
## 带标签命令
|
||
|
||
- `pnpm chartli examples/assets/weekly-signups.txt -t ascii -w 28 -h 8 --first-column-x --data-labels`
|
||
- `pnpm chartli examples/assets/weekly-metrics.txt -t columns -h 8 --first-column-x --x-axis-label Metrics --y-axis-label Count --data-labels`
|
||
- `pnpm chartli examples/assets/weekly-signups.txt -t svg -m lines -w 320 -h 120 --first-column-x --data-labels | sed -n '/^<?xml/,$p' > examples/assets/output/weekly-signups-chart.svg`
|
||
|
||
## 运行分组示例
|
||
|
||
- `pnpm run example:kitchen-sink`
|
||
- `pnpm run example:image-set:kitchen-sink`
|
||
- `pnpm run example:labeled:kitchen-sink`
|
||
- `pnpm run example:all-kitchen-sink`
|
||
|
||
## 运行全部示例
|
||
|
||
图像集图表运行:
|
||
|
||
```sh
|
||
pnpm run example:image-set:kitchen-sink
|
||
```
|
||
|
||
核心 + 图像运行:
|
||
|
||
```sh
|
||
pnpm run example:all-kitchen-sink
|
||
```
|
||
|
||
## 许可证
|
||
|
||
Apache-2.0,由 [Ahmad Awais](https://x.com/MrAhmadAwais) 基于 [Command Code](https://commandcode.ai) 构建。 |